Agenda
I`ll show how to setup a centralized logging solution running in k8s cluster that works beyond hello world examples.I`ll use local minikube but the same charts with adjustments could be used for normal k8s cluster (the real diff usually comes with usage of persistent storage).What you need to be installed:
K8s Cluster (as I said, I use minikube )
Helm (https://helm.sh/docs/intro/install/)
Code:
https://github.com/Vfialkin/vf-observability
A bit of theory first:
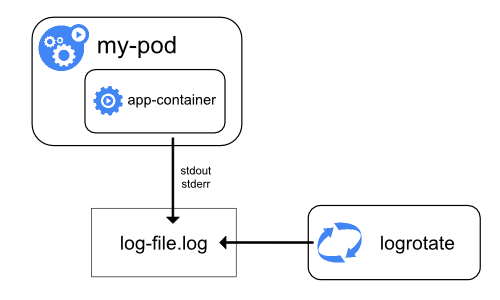
Let’s start with how logging works by default in Docker and Kubernetes.
- application log appender should forward logs to standard output, this way it will be passed to Docker container.
- default container logging driver will forward them to Pod where logs are stored as JSON files (see: configure logging drivers). There are other options for log drivers like syslog, fluentd or splunk, but for now, I’ll limit scenario to default driver.
- at the end all those files will end-up in a node folder: /var/lib/docker/containers/[containerSubfolders]
https://kubernetes.io/docs/concepts/cluster-administration/logging/#basic-logging-in-kubernetes
The good thing with this solution is that our application settings for logs are environment agnostic. The application knows how to log events but not where they will be stored, so we can move our container from cluster to cluster without changes app config (at least for log location).
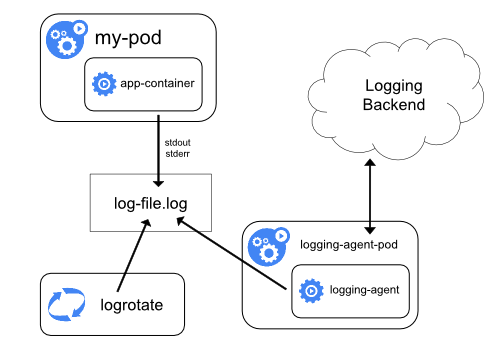
In order to collect logs from multiple nodes we need another service (agent) that will read logs and forward them to central storage (or other log processing service).
https://kubernetes.io/docs/concepts/cluster-administration/logging/#cluster-level-logging-architectures
In the current example we`ll use https://fluentbit.io/ as an agent and ELK stack as centralized storage:
- Fluent-bit log-shipping agent runs on each Node as a demon, monitors log tails and pushes data to elastic
- Elastic serves as storage for aggregated logs
- Kibana is used as a UI Dashboard

Settings and Deployment:
Enough with theory. Let’s do some helming.1) Namespace
The first thing we need is to create namespace namespace 'observability'
kubectl create namespace 'observability'2) Elastic helm chart
We need to configure elastic helm repo:
(https://github.com/elastic/helm-charts/blob/master/elasticsearch/values.yaml)
Now here are a couple of tricks to make elastic run on local in minikube:
Healthcheck:
By default, elastic health check is designed to reply only if the cluster is green state.
Sounds good in theory, but in reality, it means that cluster can easily go yellow if some index failed to replicate. What happens if healthcheck fails in k8s? - The service turns red and stops accepting requests.
It gets even trickier on a local machine if you want to run elastic cluster with just once instance. Each elastic index requires at least one replica, replicas can`t be on the same node. So cluster will be green only right after deployment. But after the first index is created cluster will turn yellow (red in k8s) and stop responding😊. So let's fix this:
Ideally, we need one node, but due to default index settings, it will cause more pain than benefits.
The next thing to fix is resources. Somehow default elastic helm chart requires at least one CPU , 2GB of RAM and 30GB of storage :\. So it’s quite easy to get into ‘recourse pending’ state during deployment and honestly, I doubt anyone needs that for a default installation.
Let’s shrink it a bit:
Elastic requires PersistentVolumes for storage. Minikube that can create those dynamicly but on k8s cluster you`ll need to create storage class and PVs manually. It is important that for non-local dev environments the persistent volumes hostPath is pointing to '/usr/share/elasticsearch/data')
Example of a yaml for a volume.yaml for one node:
helm repo add elastic https://helm.elastic.coThen we need to create an override for default helm chart
helm repo update
(https://github.com/elastic/helm-charts/blob/master/elasticsearch/values.yaml)
Now here are a couple of tricks to make elastic run on local in minikube:
Healthcheck:
By default, elastic health check is designed to reply only if the cluster is green state.
Sounds good in theory, but in reality, it means that cluster can easily go yellow if some index failed to replicate. What happens if healthcheck fails in k8s? - The service turns red and stops accepting requests.
It gets even trickier on a local machine if you want to run elastic cluster with just once instance. Each elastic index requires at least one replica, replicas can`t be on the same node. So cluster will be green only right after deployment. But after the first index is created cluster will turn yellow (red in k8s) and stop responding😊. So let's fix this:
clusterHealthCheckParams: wait_for_status=yellow&timeout=1sReplica changes:
Ideally, we need one node, but due to default index settings, it will cause more pain than benefits.
#no dedicated master nodeResources:
masterService: ""
#we don't need more than one master on local (default is 2)
minimumMasterNodes: 1
#if you set 1 replica - cluster will always be yellow because it will fail to replicate shards
replicas: 2
The next thing to fix is resources. Somehow default elastic helm chart requires at least one CPU , 2GB of RAM and 30GB of storage :\. So it’s quite easy to get into ‘recourse pending’ state during deployment and honestly, I doubt anyone needs that for a default installation.
Let’s shrink it a bit:
Shrink default resourses
 resources:
   requests:
     cpu: "250m"
     memory: "512Mi"
# Request smaller persistent volumes.Storage
volumeClaimTemplate:
accessModes: [ "ReadWriteOnce" ]
storageClassName: "standard"
resources:
requests:
storage: 200M
Elastic requires PersistentVolumes for storage. Minikube that can create those dynamicly but on k8s cluster you`ll need to create storage class and PVs manually. It is important that for non-local dev environments the persistent volumes hostPath is pointing to '/usr/share/elasticsearch/data')
Example of a yaml for a volume.yaml for one node:
kubectl apply -f .\Volume.yaml --namespace observabilityVolume.yaml
kind: PersistentVolume
 apiVersion: v1
 metadata:
   name: logs-pv-0
 spec:
   capacity:
     storage: 1Gi
   hostPath:
     path: /usr/share/elasticsearch/data
   accessModes:
     - ReadWriteOnce
   storageClassName: local-storage
   volumeMode: Filesystem
You can find a full chart in:
https://github.com/Vfialkin/vf-observability/blob/master/elastic/elastic-local.yaml
Now we can try and run it:
helm upgrade --install elastic-logs elastic/elasticsearch -n 'observability' -f .\elastic\elastic-local.yaml4) Deploy Kibana
Default chart:
https://github.com/elastic/helm-charts/tree/master/kibana
This part is easy:
1)We need to point it to installed elastic:
elasticsearchHosts: "http://elastic-logs-master:9200"again, shrink default resources resources:
  requests:
     cpu: "100m"
     memory: "256Mi" and expose service outside
 ingress:
   enabled: true
   path: /kibana-logs
   tls: []
 service:
   labels: {}
   labelsHeadless: {}
   type: NodePort
   nodePort: 30562
   annotations: {}
   httpPortName: http
   transportPortName: transport


And deploy:
helm upgrade --install kibana-logs elastic/kibana -n 'observability' -f .\kibana\kibana-local.yaml
Open Kibana to verify that is running:
4) Installing fluent-but
I left the most interesting part till the end.
Let's start with adding repo:
minikube service kibana-logs-kibana -n 'observability'
(it might take some time for Kibana to actually start and create default indexes, give it a minute or two)
4) Installing fluent-but
I left the most interesting part till the end.
Let's start with adding repo:
helm repo add stable https://kubernetes-charts.storage.googleapis.comValues override:
helm repo update
https://github.com/helm/charts/tree/master/stable/fluent-bit
The obvious part for minikube is to turn the switch:
on_minikube: true
we use elastic as a backed so:
backend:There are some bugs related to duplicated timestamp field and people recommending to replace it with something different:
type: es
es:
host: elastic-logs-master
port: 9200
logstash_prefix: logstash
time_key: "@timestamp" #https://github.com/fluent/fluent-bit/issues/628I don’t recommend doing it. @timestamp is heavily used in kibana and some of functionality will just stop working (even though it shouldn`t)
By default, the whole log message will be added to the index as a Log field. If our log entry was parsed properly we don’t need that. (It should be on only for some debug\investigation cases, otherwise this field will consume 80% of your index space)
filter: |-We work with default logging driver, sow we need to point to logs folder:
Keep_Log off
input:
  tail:
    path: /var/log/containers/*.log
The next thing is to exclude logs of kibana itself, dashboard and kube. Those write a lot and we probably need to monitor apps, not cluster:
exclude_path: /var/log/containers/kibana*.log,/var/log/containers/kube*.log,/var/log/containers/etcd-*.log,/var/log/containers/dashboard-metrics*.log
ignore_older: 1hNow, the most important part that can break your log collection if setup improperly. Fluent-bit will extend your logs with metadata from k8s (pod name, cluster name, namespace, etc). The problem is, if your log file contains any-field that has the same name, parsing will fail. Most often it happens with timestamp or log entity but you probably can`t guarantee that service running in your cluster will not try to log something else. Some people recommend to turn of JSON merging. Maybe that works if your logs are not json files, otherwise you get unstructured mess and loose ability to search and filter by field names. The workaround is to enable merge but uses some prefix to keep field names unique. In reality, it can be quite convenient for search, you always know if the message came from application or infrastructure.
filter:
   mergeJSONLog: true
mergeLogKey: "app"
with all that in place, the one thing left is to start the deployment
helm upgrade --install fluent-bit stable/fluent-bit -n $namespace -f .\fluentbit\fluent-bit-local.yaml
Setting up Kibana:
Now, we can open Kibana again:
minikube service kibana-logs-kibana -n 'observability'If you saw any articles from elastic on how to make kibana work you probably expect to see indexes and logs. That’s not really true. The ugly truth is, kibana works by default with logs structure are compatible with Elastic Common Schema (https://www.elastic.co/guide/en/ecs/current/ecs-reference.html)
otherwise, you need to set it up manually
Let’s take a look at what can we do:
a) First of all, we need to verify that new indexes are created. Go to settings - Index management. We should have some files there:

b) Then we need to create a default schema
Go to discover

And type logstash-* in a pattern name:

Provide @timestamp as a time filter field

If we go back to discover we should see some elastic logs:

I find it quite convenient when devs can use the same tools on local machine and remote cluster. You probably will need to install logging stack just once on environment but on local you'll need to repeat it every time you destroy your minikube or get a new machine\developer.
So I setup a powershell script that can install all required services for logging in one go. The script is in a git repo: https://github.com/Vfialkin/vf-observability/blob/master/DeployToMinikube.ps1
Comments
Post a Comment